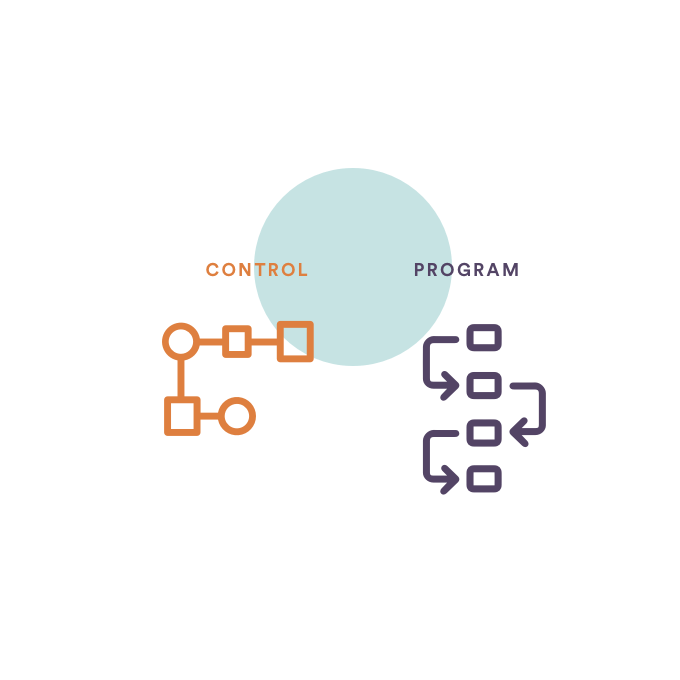
Configurable staff hierarchies and permissions
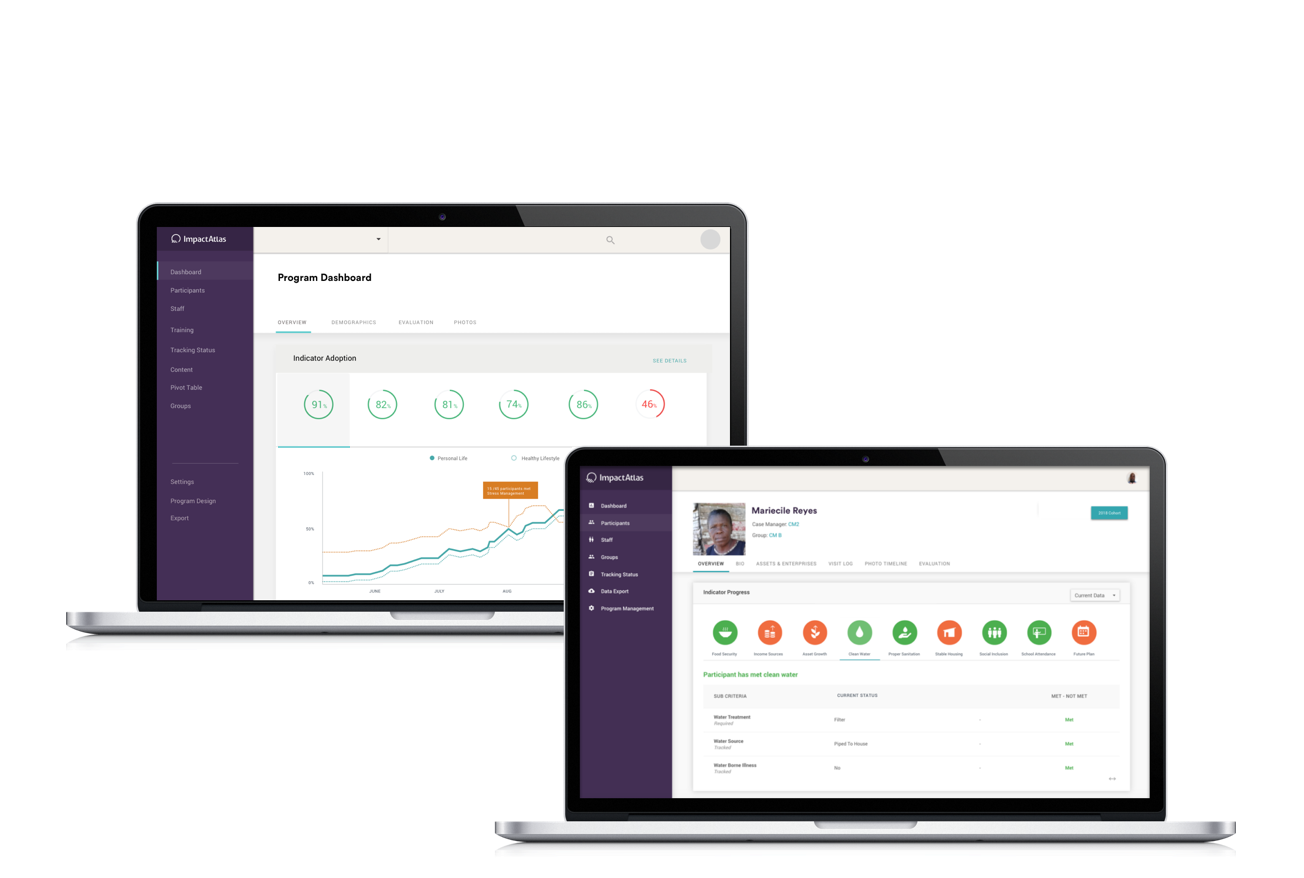
Configure dashboards to match your organization's unique management and staffing model to ensure proper access at all times.
Configure dashboards to match your organization's unique management and staffing model to ensure proper access at all times.
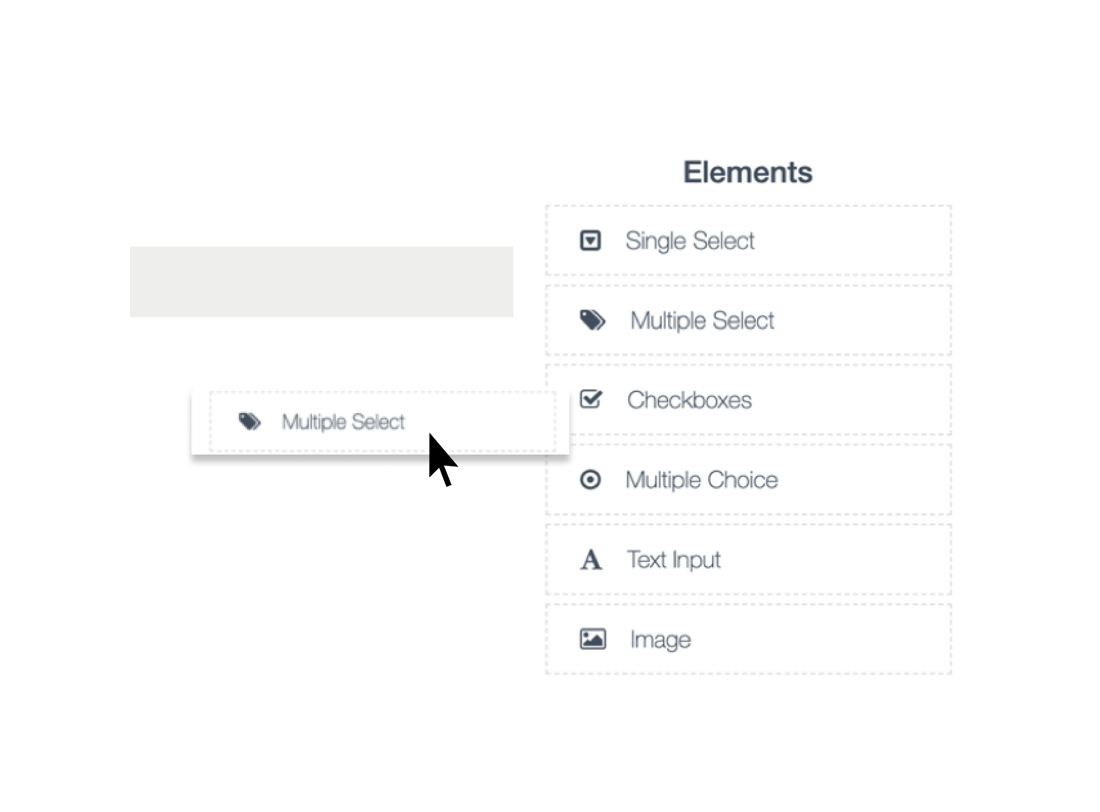
Easily concept, build and deploy simple surveys to your team all over the world, within minutes.
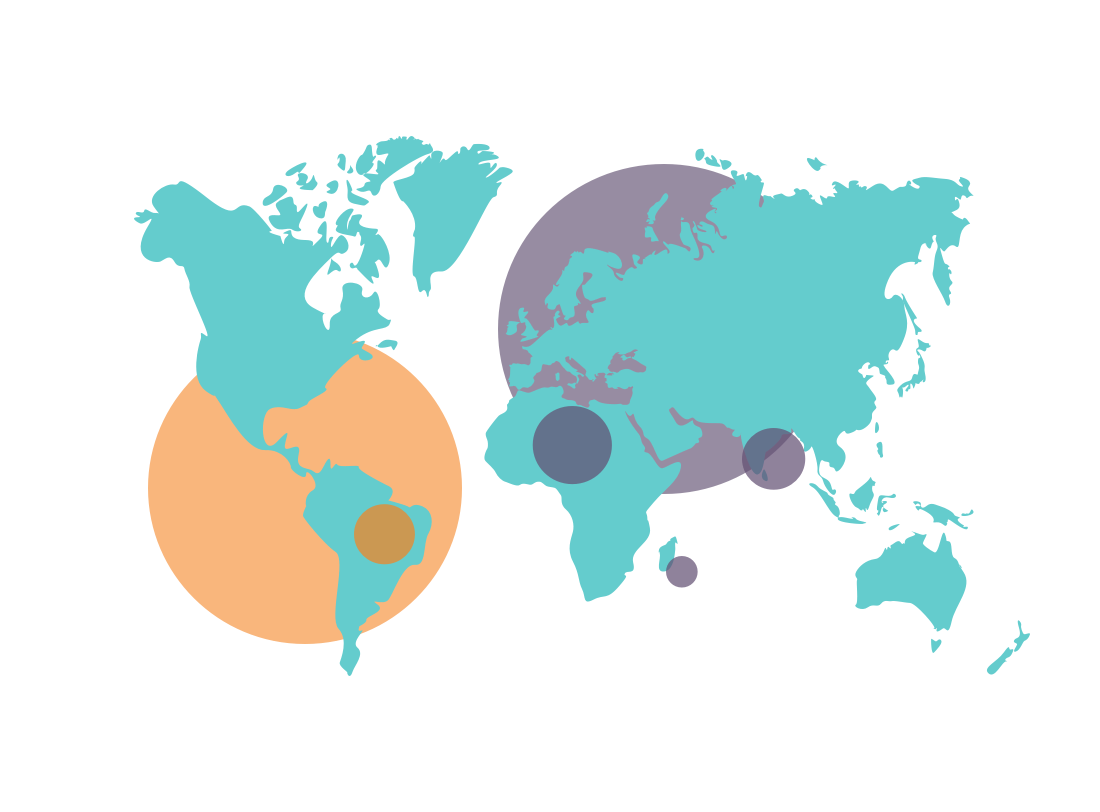
Customize your program hierarchy to align with country, regional, and local structures.
Choose from a bank of standard indicators and configure each to meet your unique program needs.
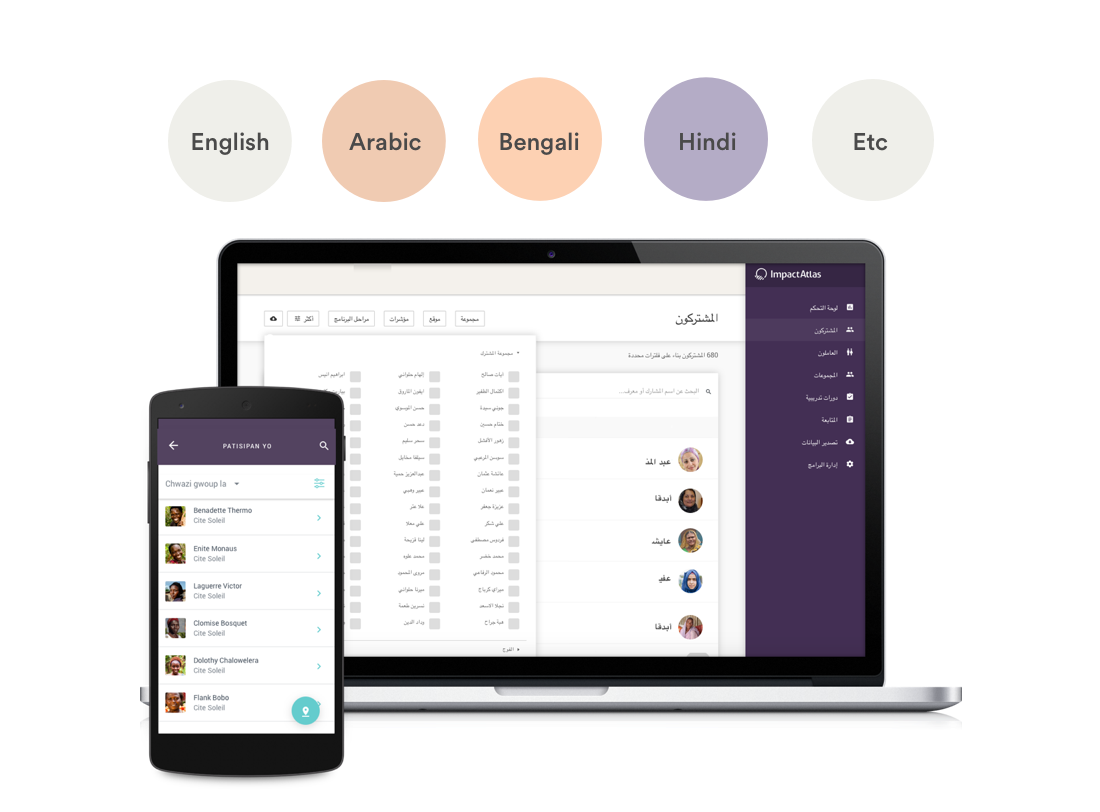
Choose the language you want for both the mobile app interface and to conduct surveys.
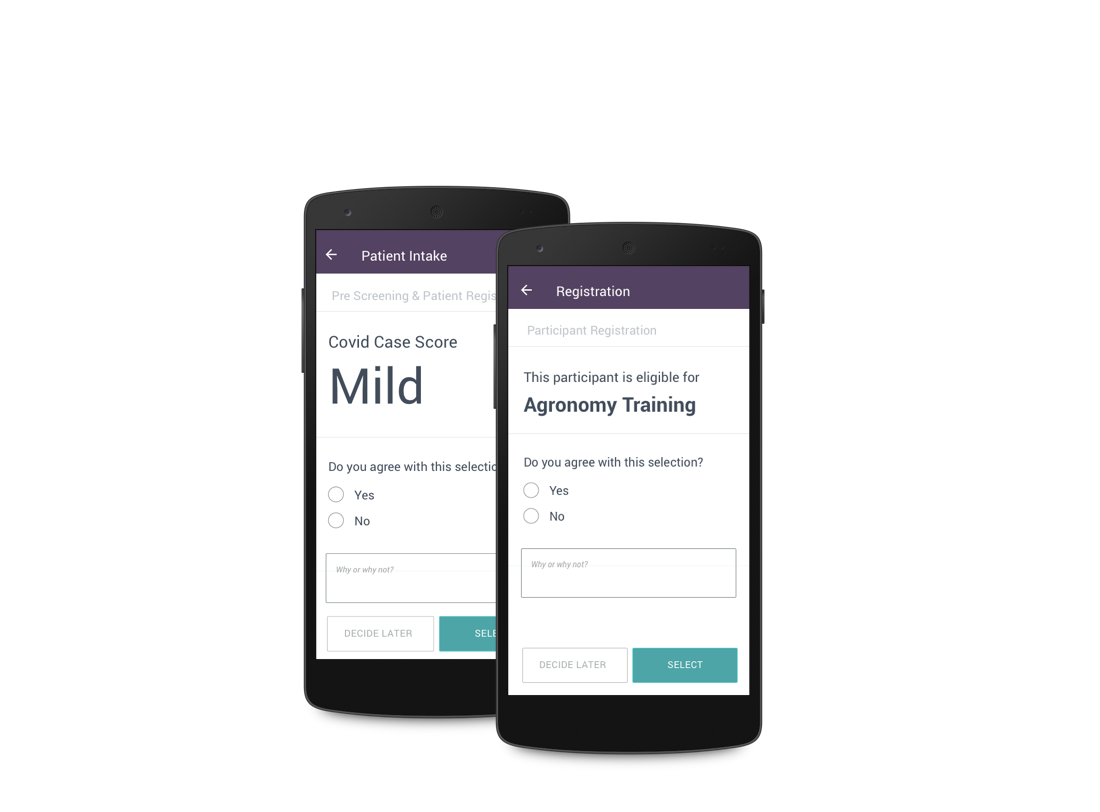
Categorize participants into multiple workflows to facilitate different treatment pathways and cohort timelines.
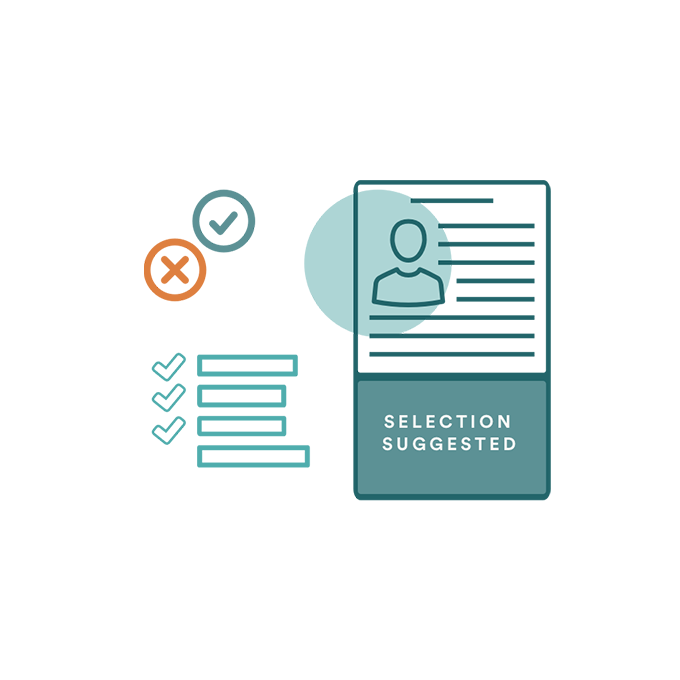
Define and customize participant criteria, enable automated verification, or configure required manual verification process.
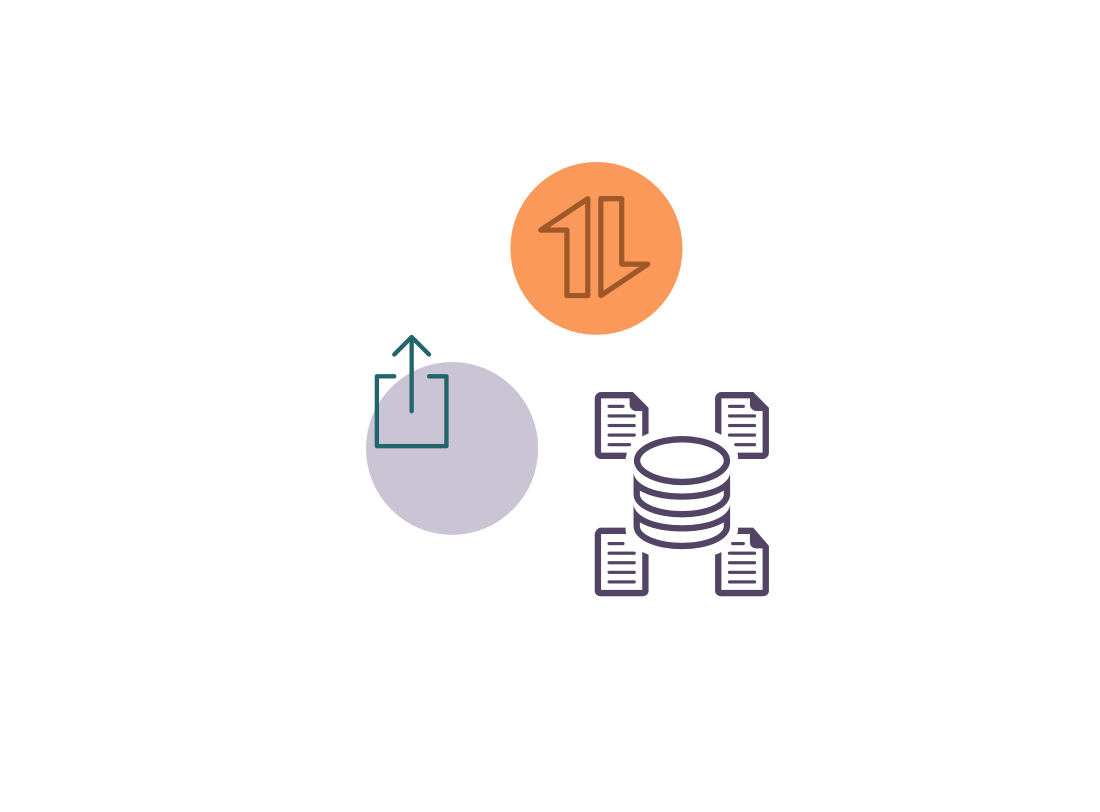
Collect high quality data anywhere, anytime — no internet required. Sync your data whenever you connect with the internet.
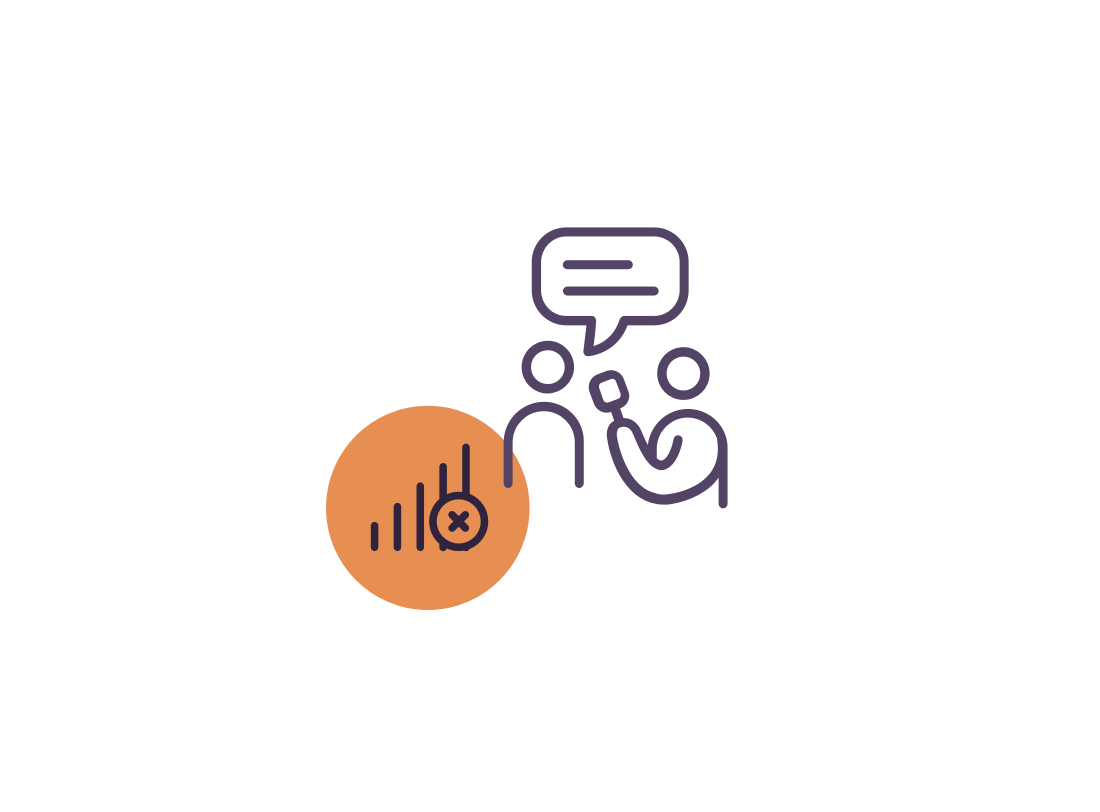
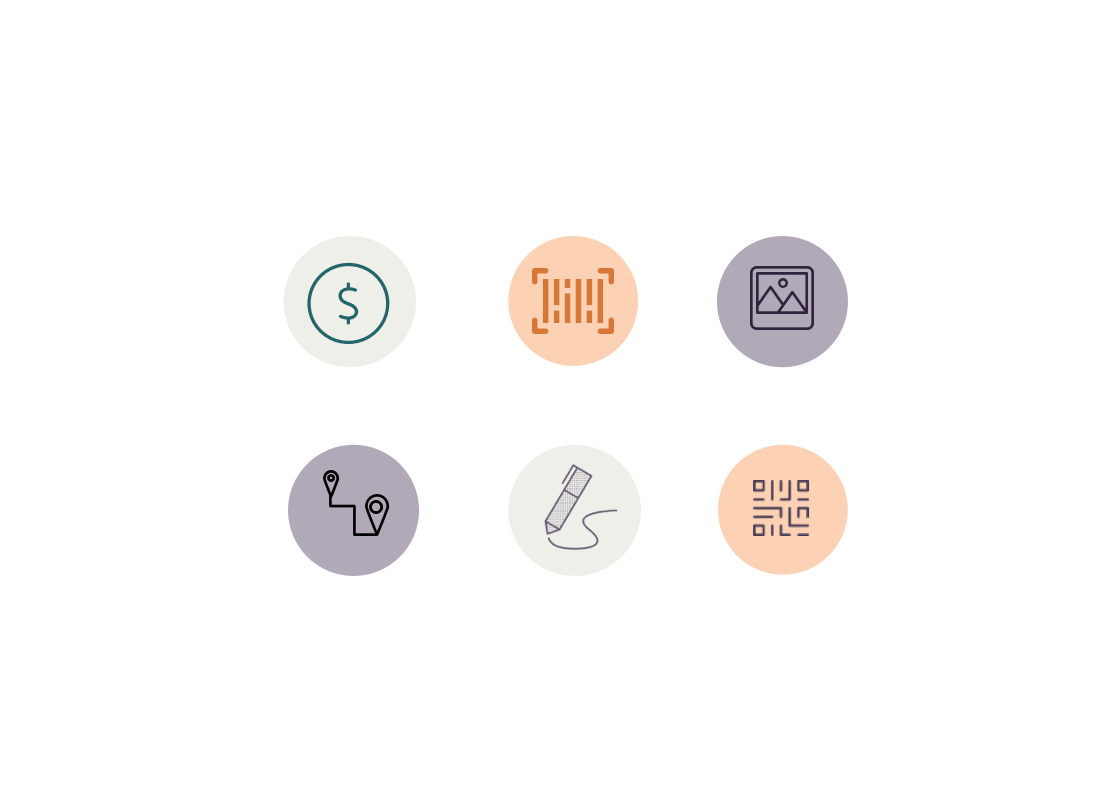
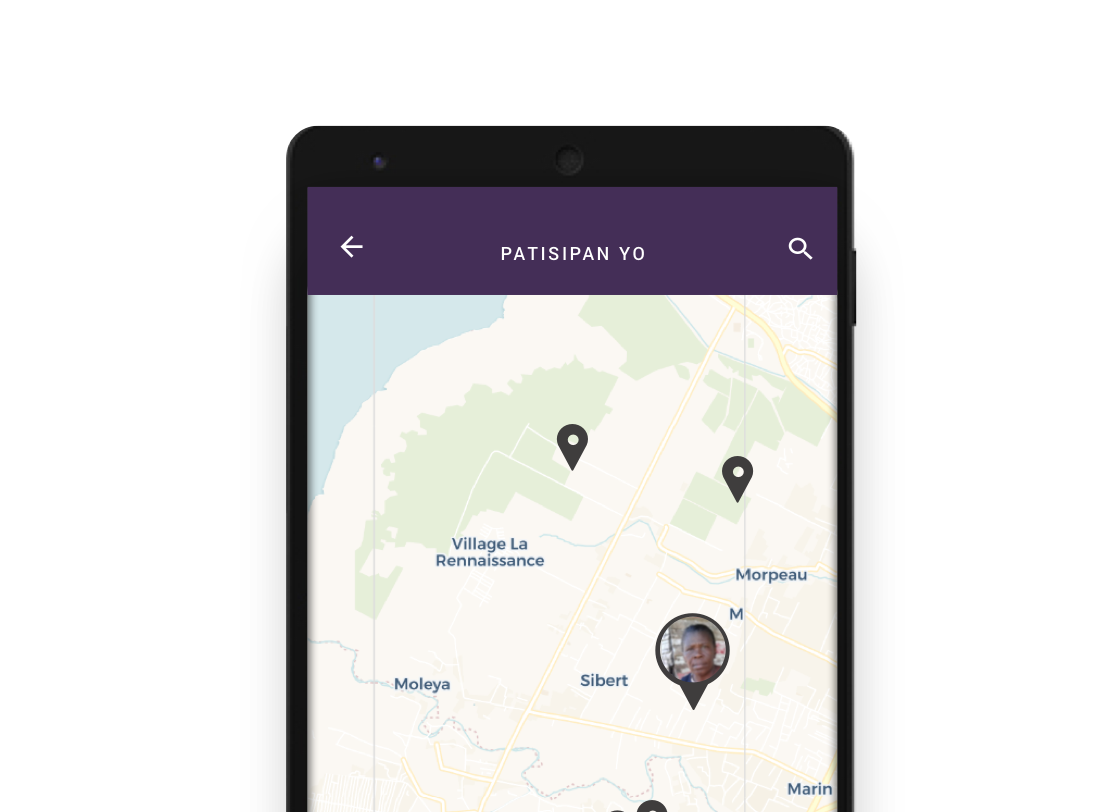
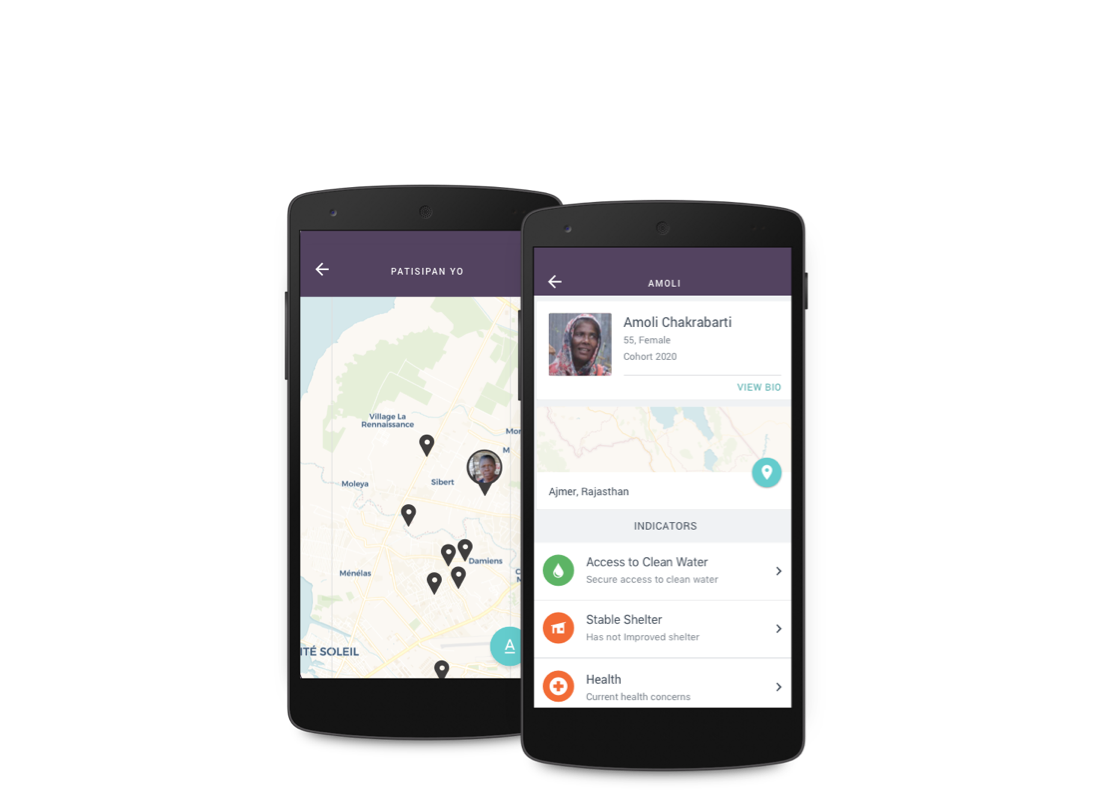
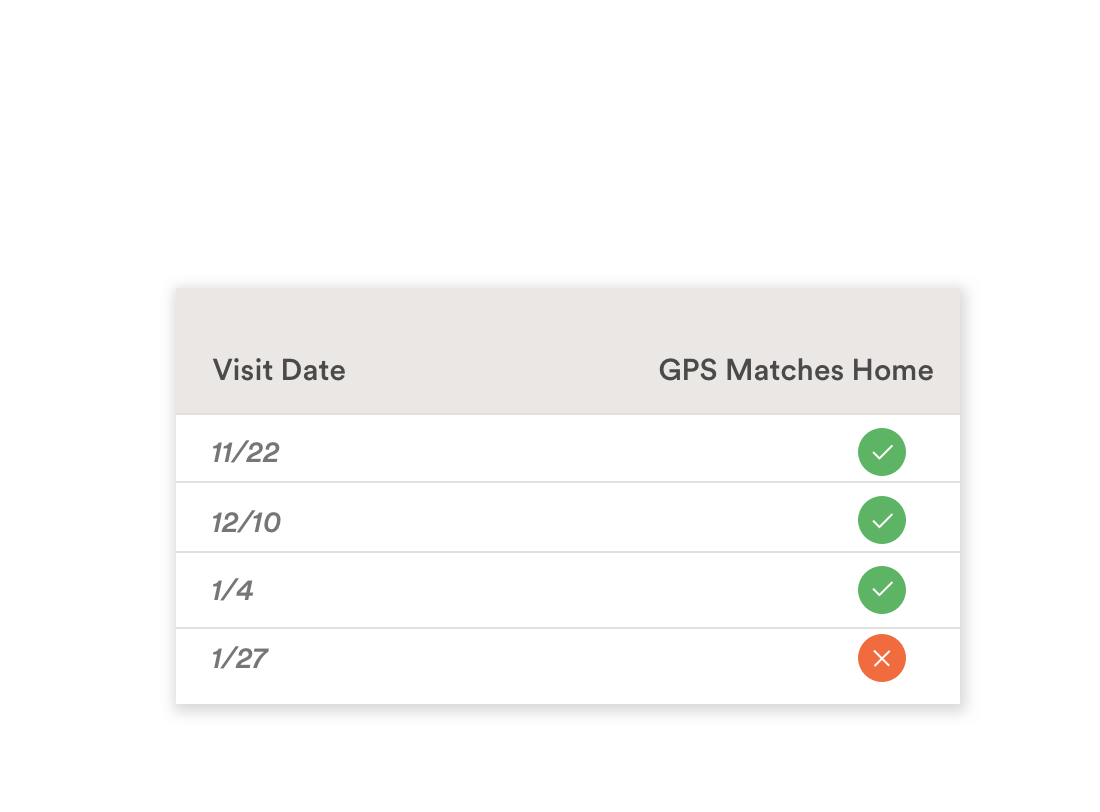
Collect any type of data from simple questions to complex group questions. Collect signatures, barcodes, QR Codes, OCR, photos, videos, audio recordings, geolocation/GPS mapping, and various other types of media.
Smart surveys leverage previously and currently collected data to ensure data capture is fast and results in high integrity inputs.
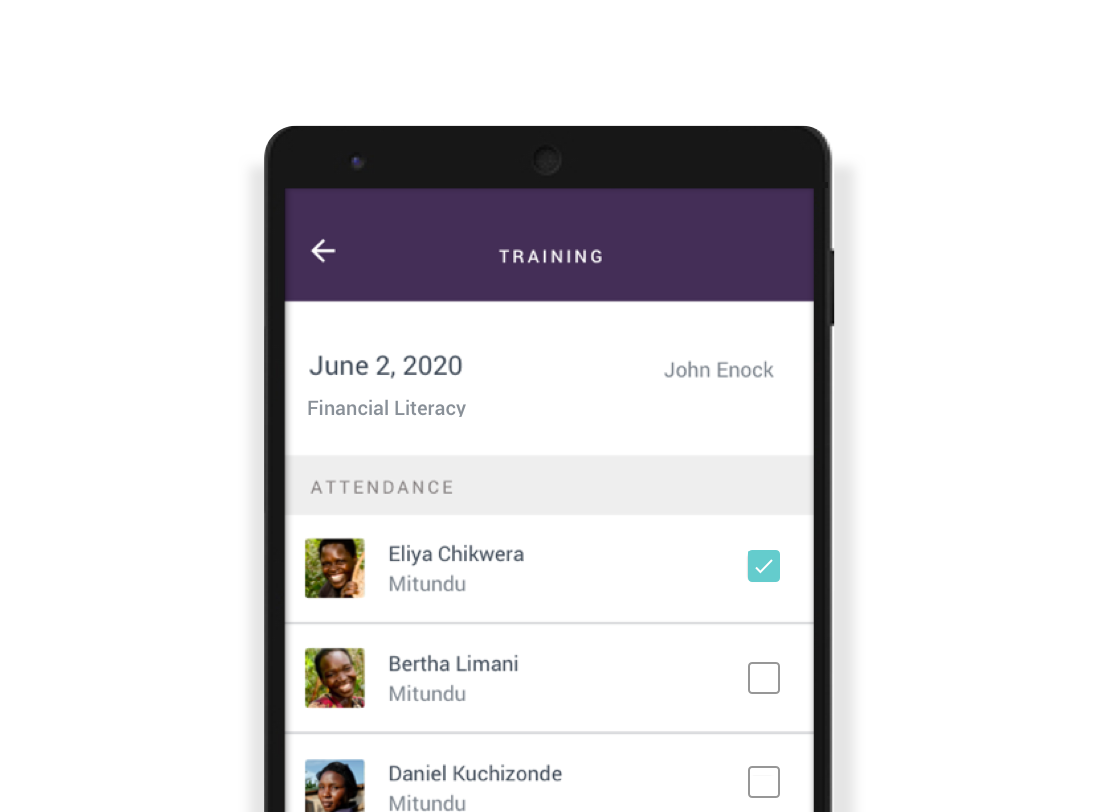
Easily track the progress of your participants engaged in training activities, spot trends in attendance numbers and track individual curriculum completion
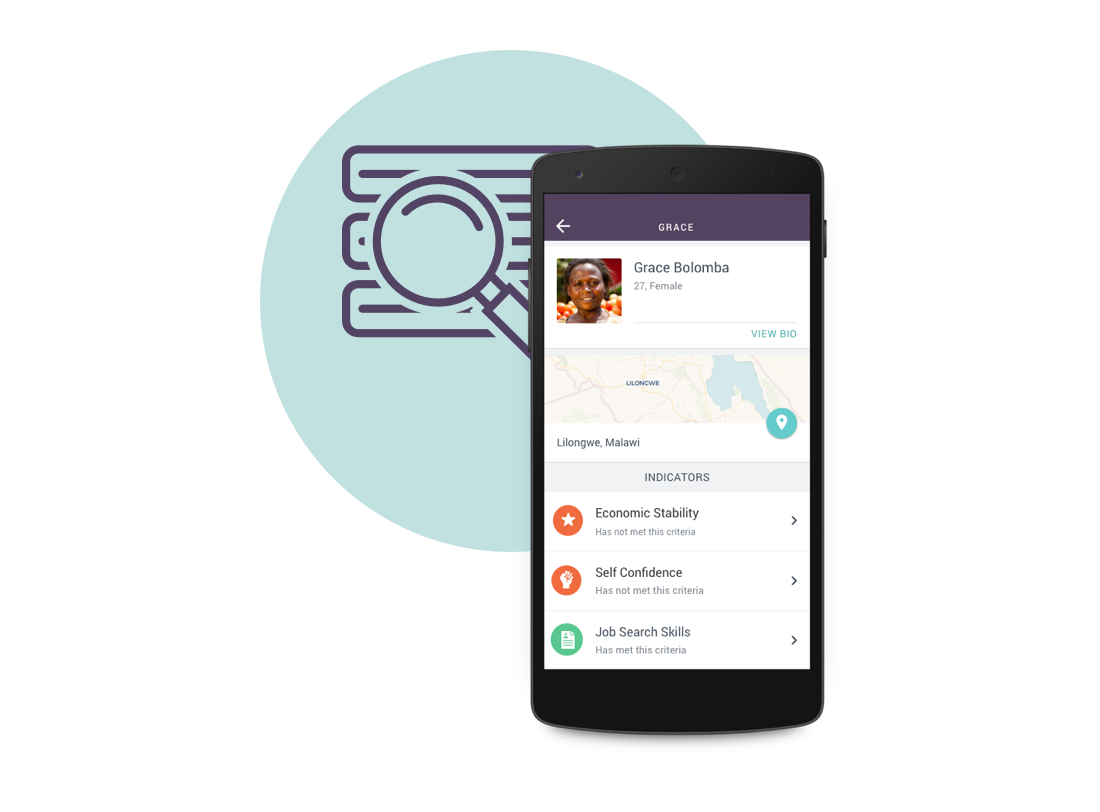
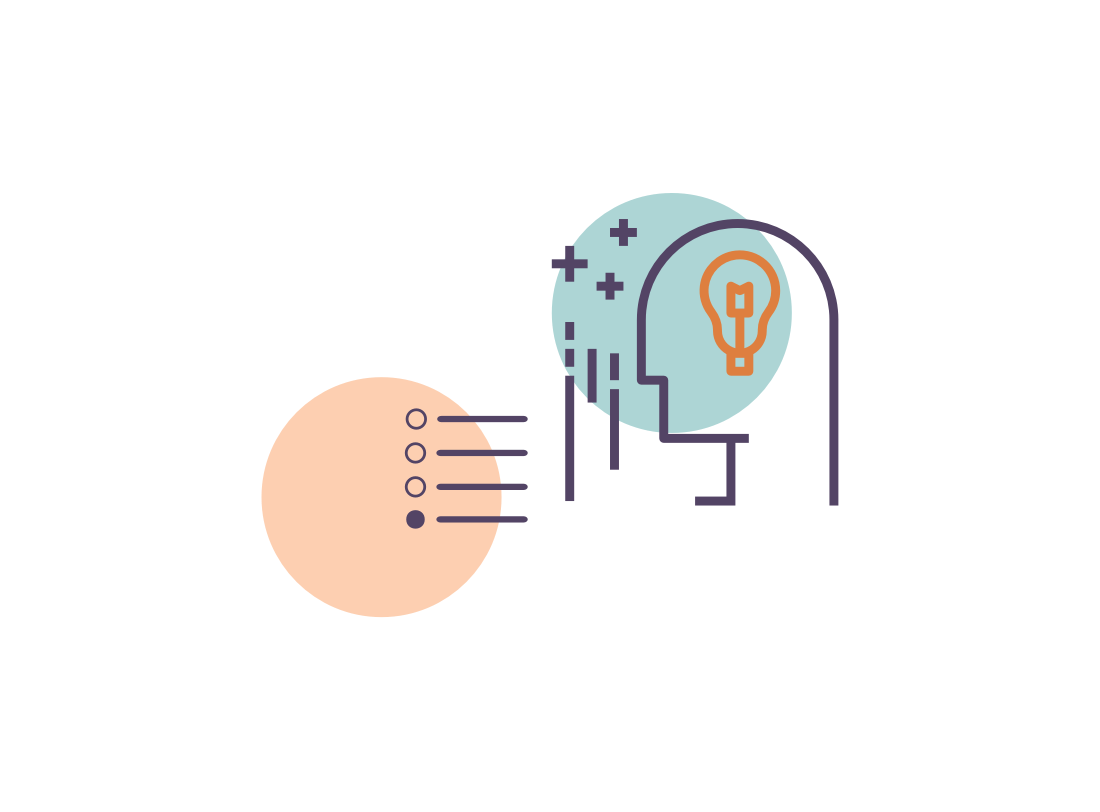
Leverage PPI and other scoring mechanisms to identify and sort potential participants.
Intuitive, fun, and easy design incentivizes quick adoption even if staff experience with mobile data collection is limited.
Allows for one-on-one data collection as well as group data collection. (ex: Trainings, Co-Op Groups, Community Gatherings)

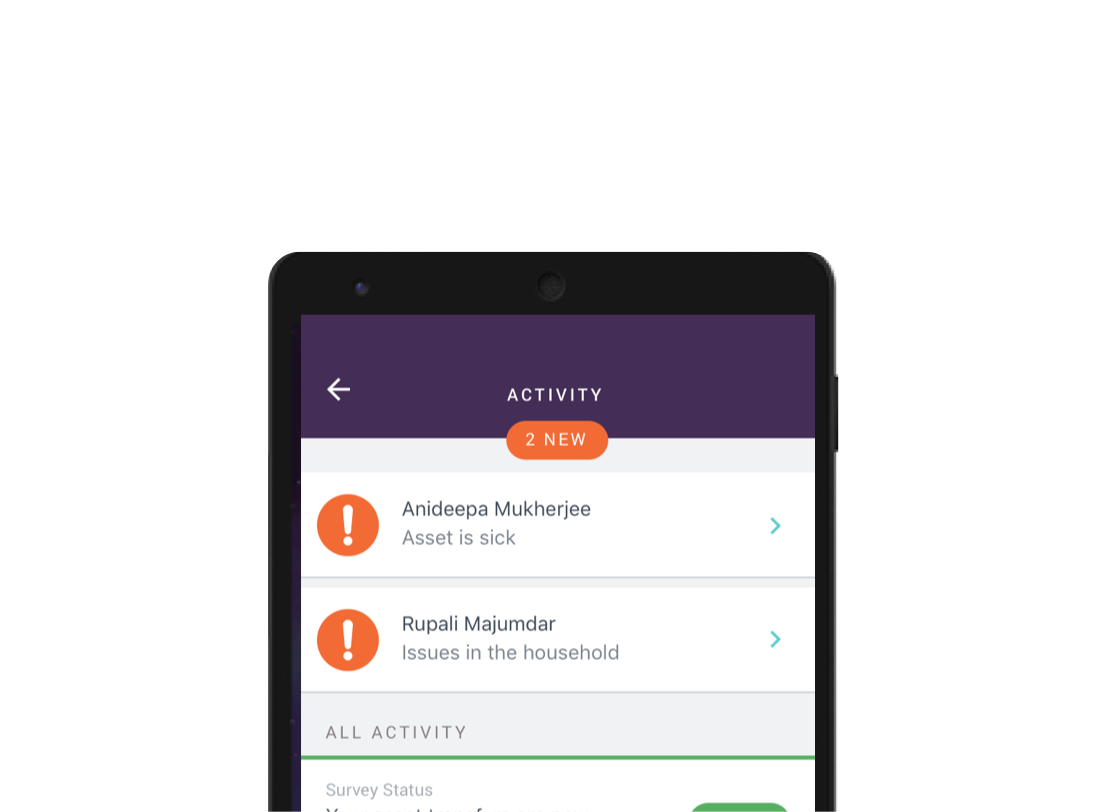
Actionable data empowers field staff to provide immediate care that is personalized to each participant's needs.
Configurable algorithm computes positive and negative deviance in participant performance to identify resource needs and oppportunities to adapt programming.
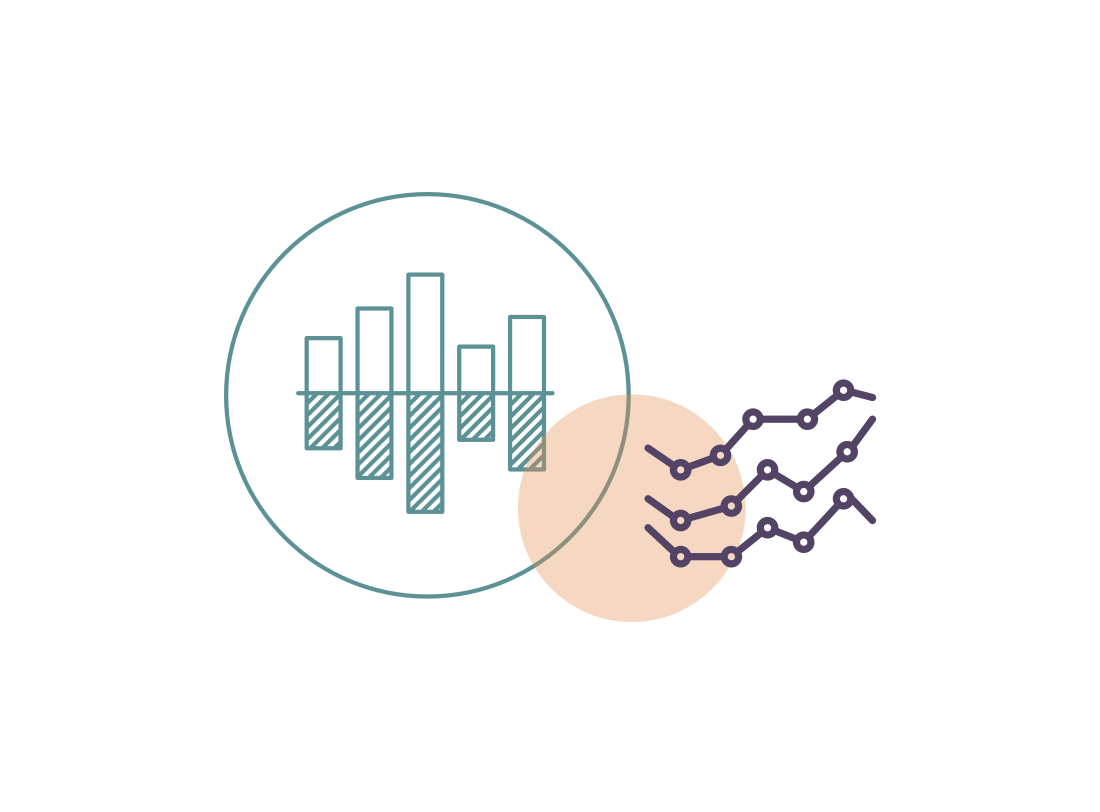
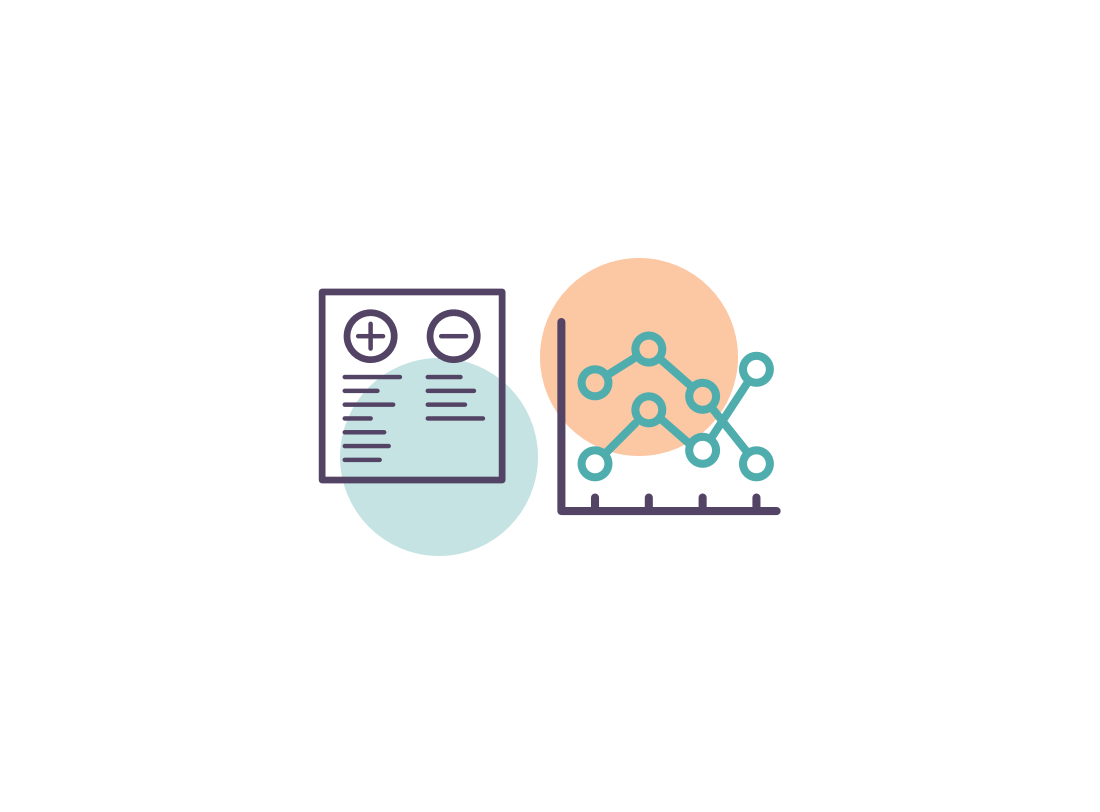
Rich visualization of performance against indicators in real-time ensures ongoing interventions are targeted most effectively.
Customize and build in real-time notifications and alerts for participant services, staff management, and important milestones.
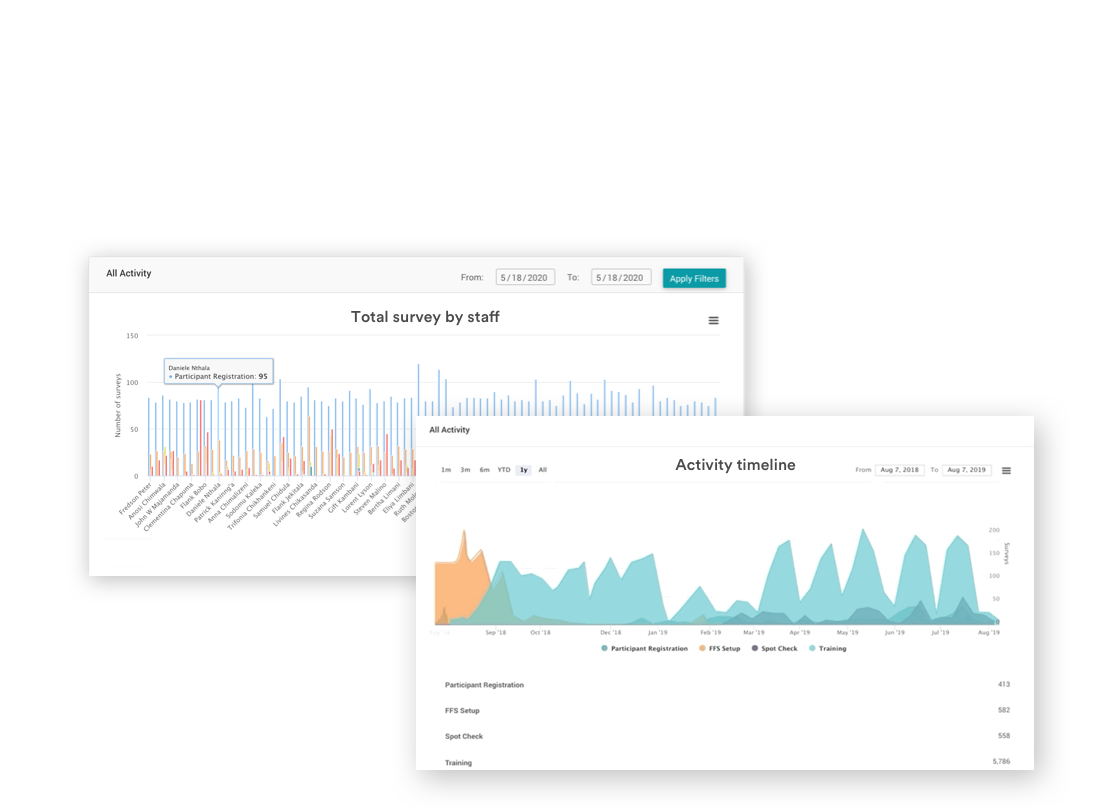
View aggregate performance and drill down to individual outcomes to understand underlying issues and higher level trends.
Progressive tracking incorporates complex qualitative and quantitative data to measure household/community improvement cumulatively and in a holistic manner over the course of your program.

Leverage aggregated data to fuel continuous learning and optimization, beyond human bandwidth.

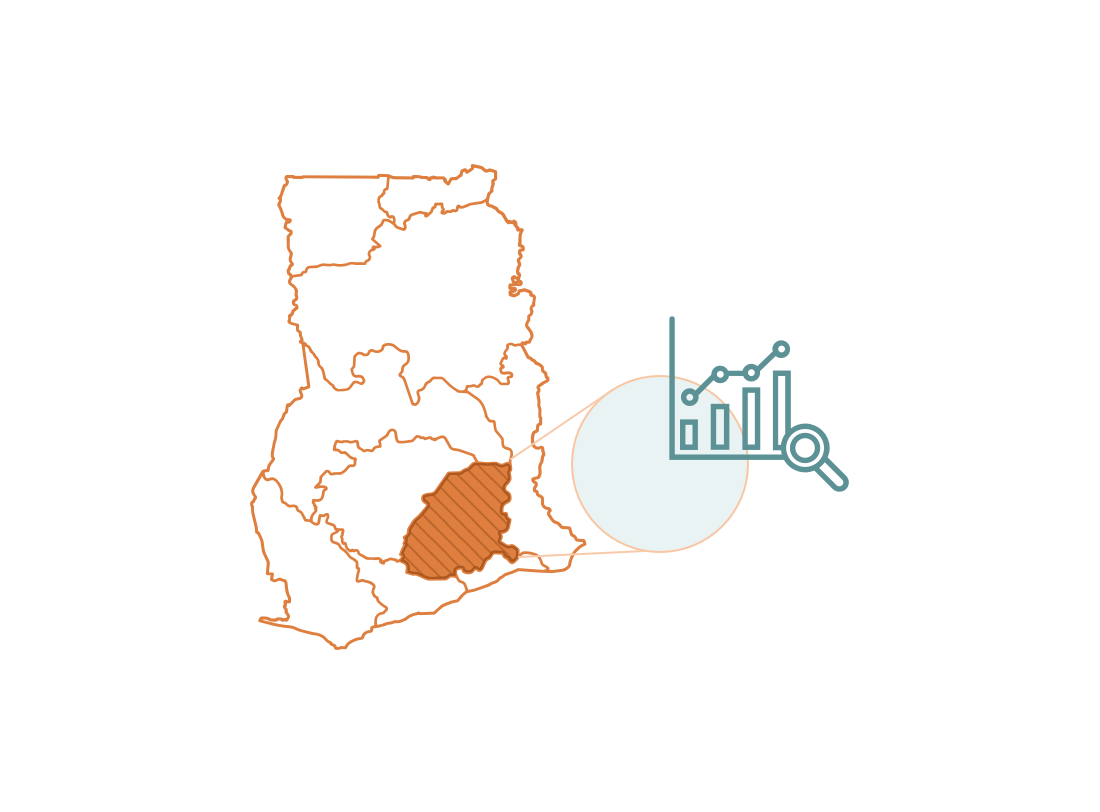
Analyze population and program progress and outcomes across dimensions of your geographical hierarchy.
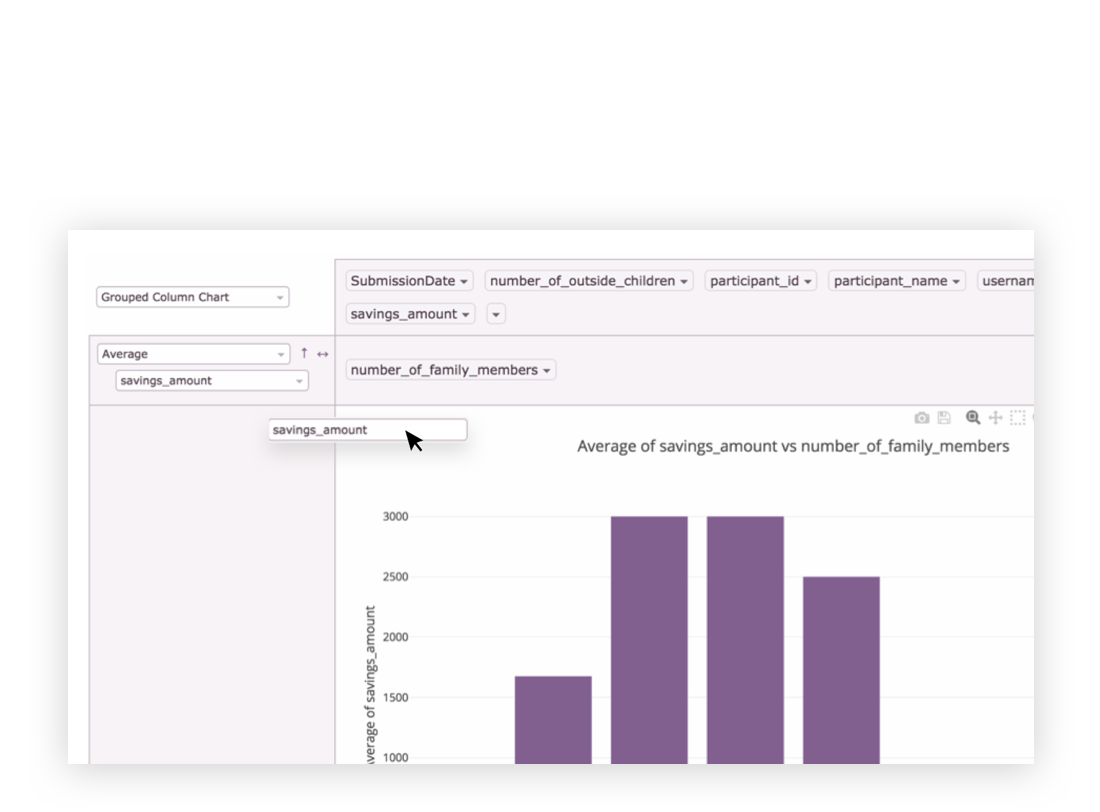
In case the visualizations already included in the dashboard are not enough, or you need to create last minute graphs for your report, easily drag and drop data points from any self-created survey. Create comparisons on the fly with bar charts, line graphs and data tables with the option to export.
Ability to create unique and tailored donor dashboards to streamline donor reports and excite donors by providing birds-eye view of high-level impact in real-time.
Performance management visualizes program execution against the scheduled workflow throughout all phases of program delivery.
Alerts provide management with advance notice of atypical activity.
Ability to measure and monitor team performance and successes across large complex programs.
Integrate program or RCT workflows directly in the platform, augmenting long-term analysis with fast-pace operational insights and lean analyses.
Quickly and efficiently test multiple hypotheses and interventions across various subgroups
Export data for rigorous econometric and statistical analysis.
All collected data is encrypted at the point of collection using a 2048-key encryption.
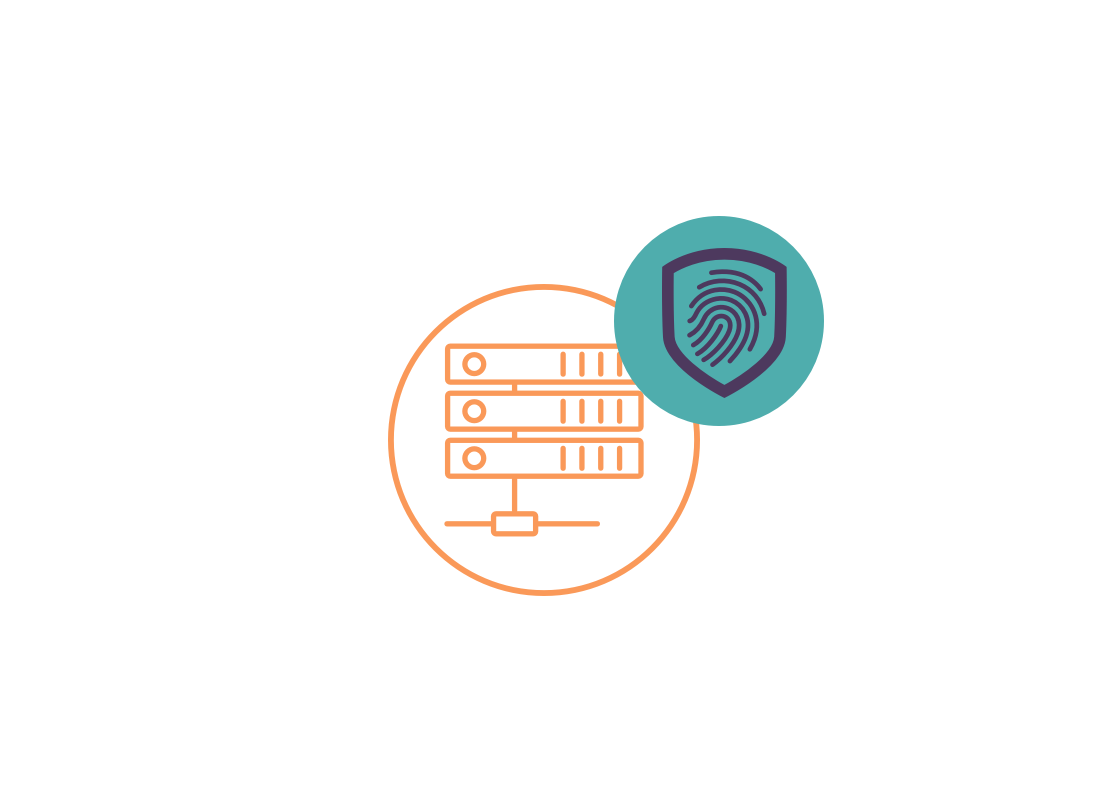
Collected data is automatically backed up on all devices and the server ensuring data is not lost and secure.
Secure data and customizable dashboard access ensures that sensitive information is appropriately accessed and viewed at the right management level.